Router Chain Trace
JSON Trace — /trace
Returns a recursive snapshot of the full router chain in JSON format:
When credential scopes are configured, pass an API key to see the route graph visible to that key:
Each node in the response contains:
router_id— identifier of the router (hostname by default)status—healthy,degraded, orunhealthycredentials— per-credential stats (type, RPM/TPM usage, ban status, error counts)models— per-model statsupstreams— nested trace responses for each connected proxy credential
Depth parameter
By default the trace follows up to 25 hops. Use ?depth=N (0–10) to limit recursion:
# Local router only
curl "http://localhost:8080/trace?depth=0"

# Two hops deep
curl "http://localhost:8080/trace?depth=2"
Response shape
{
  "router_id": "my-router",
  "status": "healthy",
  "credentials": {
    "vertex-prod": {
      "type": "vertex-ai",
      "is_banned": false,
      "current_rpm": 12,
      "limit_rpm": 600,
      "current_tpm": 5000,
      "limit_tpm": 100000
    }
  },
  "models": { ... },
  "upstreams": {
    "proxy-eu": {
      "router_id": "eu-router",
      "status": "healthy",
      ...
    }
  }
}
Fallback for legacy routers
If an upstream proxy does not yet expose /trace (older deployment), the router automatically falls back to fetching its /health endpoint and includes that data in the chain. The upstreams field will be absent for such nodes since depth cannot be traversed further.
HTML Dashboard — /vtrace
An interactive dashboard showing the router chain as a readable route diagram with per-credential tables:
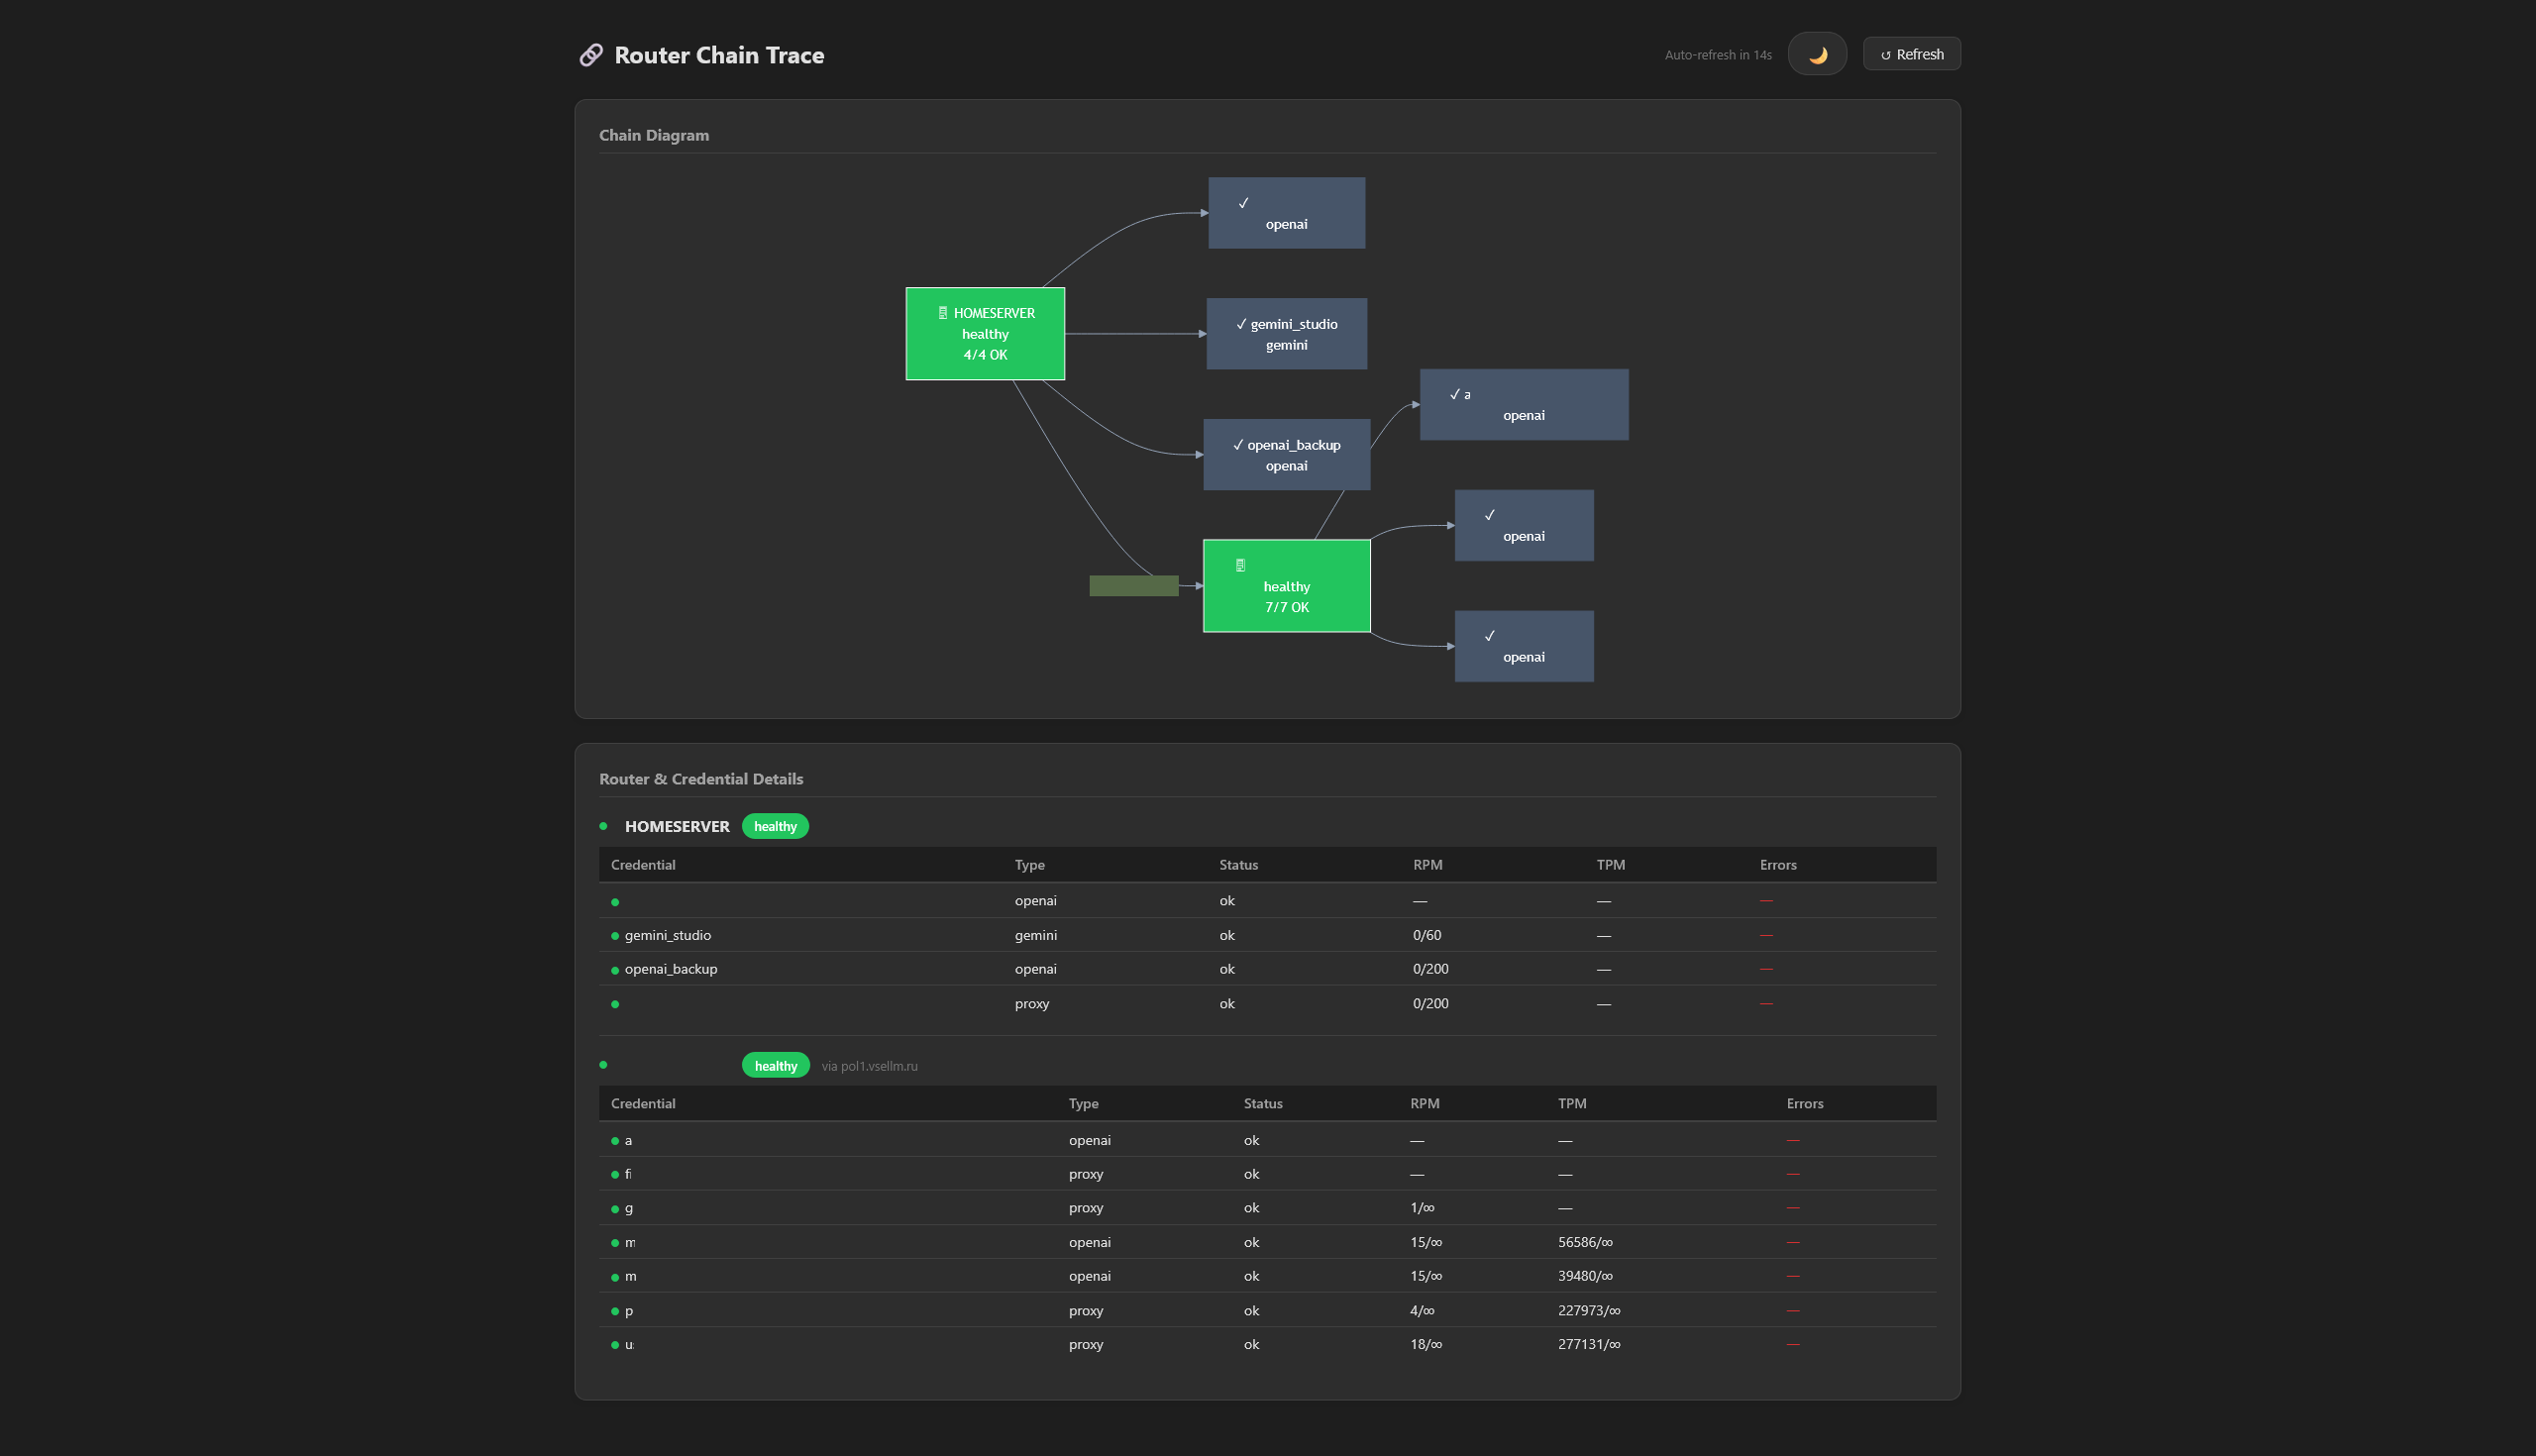
Features:
- Route diagram grouped into primary and fallback route lanes
- Legacy chain diagram below the route diagram for full topology debugging, with vector zoom up to 2000%
- Router focus tabs and proxy cards to drill into a downstream proxy node without rendering the whole tree
- Provider-family filters inferred from model names, for example Anthropic, OpenAI, Google, ZAI, Qwen, or proxy
- Model text filter for narrowing a route view to one model family or concrete model name
- Primary/fallback route lanes showing provider URLs and when traffic moves to fallback on 429, 5xx, ban, or limit pressure
- Per-router credential tables with source type, primary/fallback role, model-provider family, RPM/TPM usage, ban status, and error codes
- Auto-refresh every 30 seconds
- Dark / light theme toggle with preference saved in
localStorage
Notes
- Trace endpoints do not require authentication. Missing, invalid, or temporarily unverifiable API keys use the public view, which only includes credentials without
scopes - The depth parameter is capped at 10 to prevent runaway recursion
- A 15-second request timeout is applied to the full chain traversal
- Upstream fetches are rate-limited to one request per 100 ms per credential